Whether you’re a developer, a systems admin, or a DevOps engineer, it’s common to encounter situations where you need to examine various types of logs to identify bugs or detect any unusual activities within the system. This is where a centralized logging system can be incredibly useful, allowing you to aggregate all logs in one place for easy access and analysis. In this article, I will provide a step-by-step guide to help you implement a centralized logging system using the ELK stack (Elasticsearch, Logstash, and Kibana). This powerful combination of tools will enable you to efficiently collect, process, and visualize log data, ultimately improving your system’s monitoring and troubleshooting capabilities.
What is the ELK stack?
ELK is known for a stack that comprises three popular projects: Elasticsearch, Logstash, and Kibana.
You can easily search for ELK on Google to know more. I will say ELK stack basically gives you the ability to aggregate logs from all your systems and applications, analyze these logs, and create visualizations for application and infrastructure monitoring in a centralized way, faster troubleshooting, security analytics, and more.
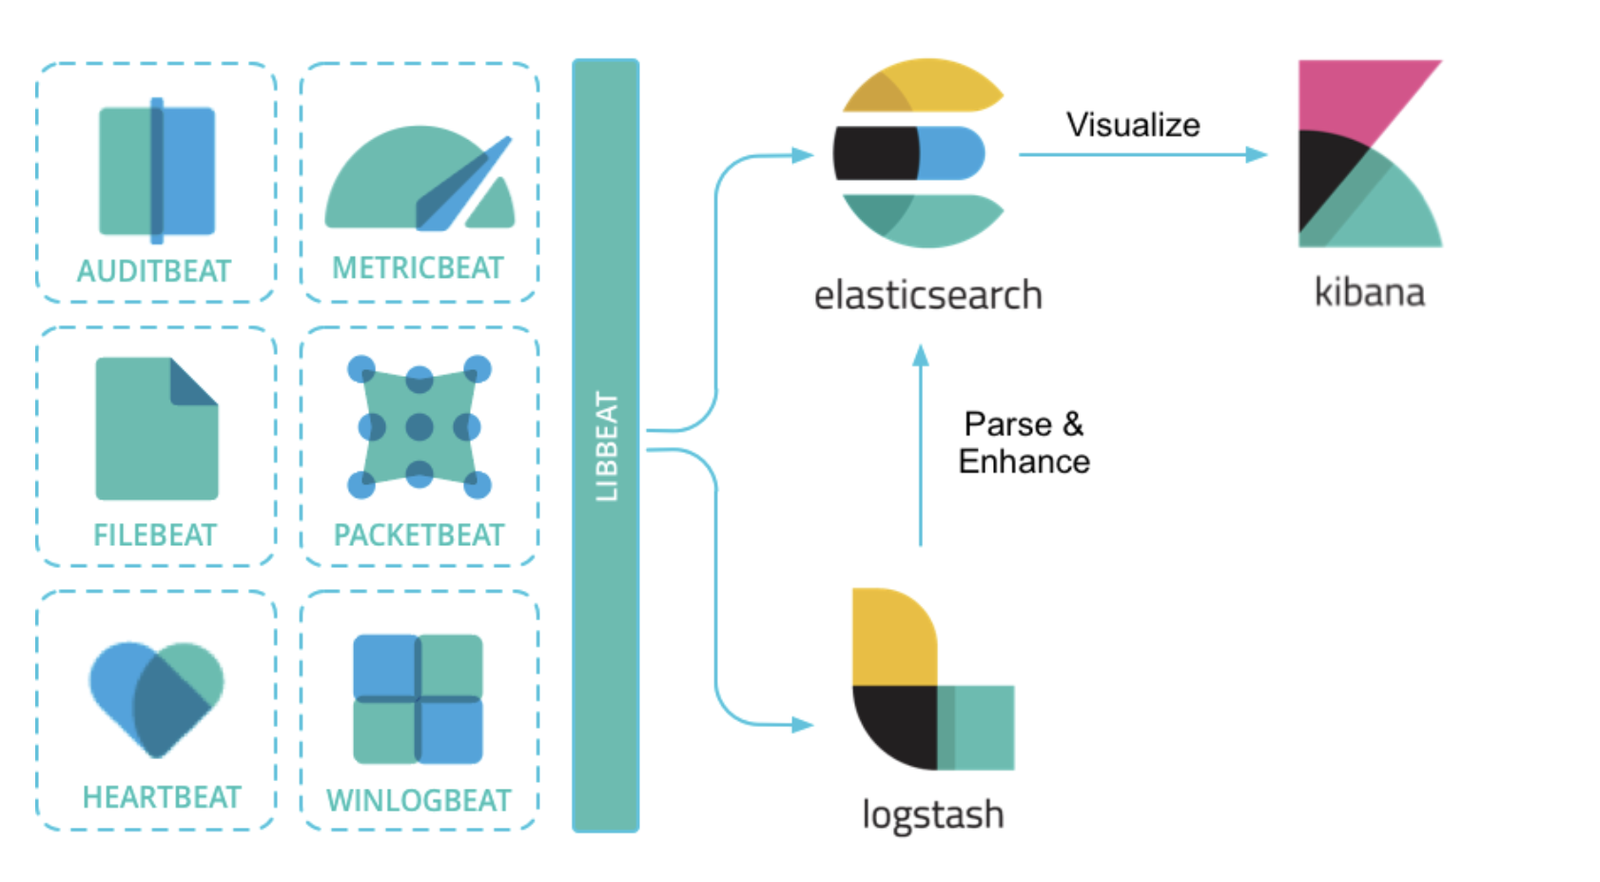
Have a quick look through the graph

To implement a centralised logging system, it basically has four main components:
- Filebeat (or whatever beats): is a tool that collects logs on servers where the application running. In this article, we use Filebeat
- Logstash: is another tool that collects data from all disparate sources (data from all beats), and then processes data, makes it cleaner and more informative, and sends processed data to a unique destination (Elasticsearch).
- Elasticsearch: is the distributed search and analytics engine at the heart of the Elastic Stack, it simply means the tool where we perform a course of query actions on the data that Logstash sends to Elasticsearch.
- Kibana: is the front-end GUI for Elasticsearch, helps us visualise the query data
Here is our basic setup to centralise logs:

I have two Ubuntu 22.04 servers with Firewalld turned off:
- Server 1: 192.168.68.112 (Web-01) – Install Nginx and Filebeat. Use Filebeat to collect Nginx’s logs.
- Server 2: 192.168.68.111 (ELK) – Install Elasticsearch, Logstash, and Kibana.
ELK packages and Filebeat are released in the latest version 8.17.3.
This is a demo version of local virtual machines. However, it’s the same setup if you want to deploy on an AWS EC2 instance or any other cloud provider. Just remember to open the corresponding ports.
We have 3 main steps:
- Step 1: Install and configure ELK stack on Server 2
- Step 2: Install and configure Filebeat and Nginx on server 1
- Step 3 (Optional): Configure Logstash to tailor log indices for different log types
Step 1: Install and configure ELK stack on Server 2
1. Firstly, we need to install and set up ELK on server 2.
Use the command below to create a file setup-elk.sh and grant execution permission to the file. Note: I recommend logging in as “root” to run without sudo because we might encounter unexpected errors. I’ll talk about it at Kibana’s verification code.
mkdir elk && cd elk/
touch setup-elk.sh && chmod +x setup-elk.sh
vi setup-elk.sh
Paste the content below into the file
#!/bin/bash

# Install Java Development Kit (JDK) and package dependencies
apt update
apt install -y default-jdk apt-transport-https

# Setup Elasticsearch repository
wget -qO - https://artifacts.elastic.co/GPG-KEY-elasticsearch | sudo gpg --dearmor -o /usr/share/keyrings/elasticsearch-keyring.gpg
echo "deb [signed-by=/usr/share/keyrings/elasticsearch-keyring.gpg] https://artifacts.elastic.co/packages/8.x/apt stable main" | sudo tee /etc/apt/sources.list.d/elastic-8.x.list

# Install Elasticsearch
apt update && apt install -y elasticsearch

# Configure Elasticsearch to listen on all network interfaces
# This is for other servers can send data to and we can access from outside without login through localhost on the server
echo "network.host: 0.0.0.0" >> /etc/elasticsearch/elasticsearch.yml

# Start Elasticsearch service
systemctl enable elasticsearch
systemctl start elasticsearch

# Install Logstash
apt install -y logstash
systemctl enable logstash

# Install Kibana
apt install -y kibana

# Configure Kibana listen on all network interfaces that allow other servers can access to.
echo "server.host: 0.0.0.0" >> /etc/kibana/kibana.yml

# Start Kibana service
systemctl enable kibana
systemctl start kibana

# Sleep 5 minutes to wait for all Elasticsearch, Logstash, and Kibana start completely
sleep 5m

# Reset password for the "elastic" built-in superuser.
elastic_password=$(echo "y" | /usr/share/elasticsearch/bin/elasticsearch-reset-password -u elastic | grep -o "New value: .*" | cut -d ' ' -f 3-)

# Generate kibana enrollment token
kibana_token=$(/usr/share/elasticsearch/bin/elasticsearch-create-enrollment-token -s kibana)

# Go to kibana share directory and run command.
cd /usr/share/kibana && verification_code=$(./bin/kibana-verification-code)

# Display Login Credentials::
echo ""
echo ""
echo "Login Credentials:"
echo "=================="
echo "Elasticsearch:"
echo "   Username: elastic"
echo "   Password: $elastic_password"
echo ""
echo "Kibana:"
echo "   Enrollment Token: $kibana_token"
echo ""
echo "Kibana's verification code:"
echo "$verification_code"
Press :wq! to save the content and exit the file.
Install ELK packages
./setup-elk.sh
NOTE: If use your own user (non-root), it will likely be failing at executing ./bin/kibana-verification-code to get the verification code.
The error “Couldn’t find verification code” below is an example, should run as “root” to bypass the error, I’ve tried running with sudo from “non-root” user, but still get the same error for some reasons:

If you have a result similar below, you’ve successfully installed the ELK packages.

Open a browser and access https://192.168.68.111:9200/ (HTTPS is mandated for security reasons)- Check Elasticsearch’s status. Use the username/password displayed on the terminal.

You will have a result like this.

Note: if you don’t want to remember particular IP addresses – I would suggest that you check out my blog How to Set Up a Local DNS Server with Dnsmasq in Ubuntu 24.04 (Fast & Easy) so that you will use domain instead. At the time of writing this ELK blog, I wouldn’t use DNS and just use the plain IP address instead.
Next, we go to http://192.168.68.111:5601/ to configure Kibana to enroll the Elasticsearch. Copy the Kibana’s generated token from the terminal and paste it here. Then click Configure Elastic.

It’s asking to enter the verification code. Fill in the verification code that we have from the terminal. Click Verify.

Waiting for Kibana to start and complete the setup…

Once the setup finishes, a login page will appear, log in the page with Elasticsearch’s username/password that you have from the terminal.

Here is the outlook if you have done everything correctly. Select Explore on my own

Ok. We’re done. You’ve got a home page!

2. Configure Logstash to receive log data from Filebeat or other sources.
Logstash has a /etc/logstash/conf.d/ where it stores configuration files tailored according to our requirements. I’ll create a nginx-logstash.conf file (for receiving Nginx logs) only here to make it simple first, then I’ll show how to parse different log types to Elasticsearch.
Still on server 2, we can name the file anything we want, but I’ll call it nginx-logstash.conf, we run:
cd /etc/logstash/conf.d/
vi nginx-logstash.conf
In this configuration file, we mainly care about three things: input, filter, and output. However, we mainly need input and output in this first example. The filter plugin is used to modify the raw data, which I’ll show you in the step of sending different log types later.
Copy and paste the content below into the nginx-logstash.conf file:
input {
  beats {
    port            => 5044
  }
}

output {
  elasticsearch {
    index => "nginx-logstash" # we set a fixed index's name, later I'll show you how to dynamically set name based on each log type
    hosts => ["192.168.68.111:9200"] # Change this to your hostname
    user => "elastic"
    password => "zgILNPL4N0wnulw5tDrv" # Change this to your password
    ssl_enabled => true
    ssl_verification_mode => none #Enable "full" and you will need to implement /etc/elasticsearch/certs/http_ca.crt.
  }
}NOTE: In the old Logstash versions, we have options below that have changed to new options in the latest version:
ssl-> changed tossl_enabledssl_certificate_verification-> changed tossl_verification_mode
You can still use ssl or ssl_certificate_verification in this version, but it’s deprecated now and will be removed in the future. So, probably try to adapt new setting.
Restart the Logtash service to make the new configuration take effect.
systemctl restart logstash
Optional: If your server enables a firewall, run this command to allow other servers to send events to Logstash on ELK server through port 5044/tcp without being blocked.
ufw allow 5044/tcpStep 2: Install and configure Filebeat and Nginx on server 1
1. Install Nginx
apt update && apt install nginx
You’ve got the same result if you access your server. Here is mine:

2. Install and configure Filebeat
Install dependency packages
apt install -y apt-transport-https wget
Configure Elasticsearch repository to allow Filebeat installation
wget -qO - https://artifacts.elastic.co/GPG-KEY-elasticsearch | sudo gpg --dearmor -o /usr/share/keyrings/elasticsearch-keyring.gpg

echo "deb [signed-by=/usr/share/keyrings/elasticsearch-keyring.gpg] https://artifacts.elastic.co/packages/8.x/apt stable main" | sudo tee /etc/apt/sources.list.d/elastic-8.x.list
Run apt update to update the repository
apt update
Install Filebeat
apt install -y filebeat
Backup filebeat.yml to take it as a reference in the future if needed.
mv /etc/filebeat/filebeat.yml /etc/filebeat/filebeat.yml.bak
Start and enable Filebeat
systemctl enable filebeat
systemctl start filebeat
It’s showing filebeat service is running if you check systemctl status filebeat:

Run
vi /etc/filebeat/filebeat.yml
and this content:
fields_under_root: false
filebeat:
  config.inputs:
    enabled: true
    path: "/etc/filebeat/conf.d/*.yml" # configure a separte directory to store config files of each corresponding log type
  config.modules:
    enabled: false
    path: "/etc/filebeat/modules.d/*.yml"
  shutdown_timeout: '0'
  modules: []
  registry:
    path: "/var/lib/filebeat"
    file_permissions: '0600'
    flush: 0s


output.logstash:
  hosts: ["192.168.68.111:5044"]

logging.level: info
logging.to_syslog: false
logging.to_files: true
logging.files:
  path: /var/log/filebeat
  name: filebeat
  keepfiles: 7
  permissions: 0640
Create /etc/filebeat/conf.d/ to store various custom filebeat config files for each log type. We can actually add our configuration of Nginx’s log to /etc/filebeat/filebeat.yml directly but creating a separate file for each log type makes it easier for troubleshooting and management. It’s based on your style so I’ll let you decide. For more information on the Filebeat setting, we can view it here.
mkdir -p /etc/filebeat/conf.d/
Run vi /etc/filebeat/conf.d/nginx-logs.yml and add this content:
---
- type: log
  paths:
  - /var/log/nginx/access.log  # collect data from an exact log
  - /var/log/nginx/*.error.log # also can set like this to collect all logs with specific extention
  encoding: plain
  scan_frequency: 10s

  fields:
    type: nginx                # we use this field to in filter option to change each log type to the output
  fields_under_root: true      # need to set to true here, otherwise, the fields.type: nginx won't be added to Filebeat
Regarding fields_under_root, we can check out here to know more.
Run filebeat test output and if you get output like this, the server is ready to send logs to Logtash

Restart filebeat service to make the new configuration take effect.
systemctl restart filebeat.service
Now Filebeat is reading /var/log/nginx/access.log and parses the data and sends it to Logstash server. We will see the result on Kibana. See next…
3. Configure Kibana to visualise data sent from Logstash to Elasticsearch
Open Kibana at http://192.168.68.111:5601/ again. Go to the Menu (at the top left corner) -> Stack Management.

We will see an index: nginx-logstash, which will appear here if you configure Filebeat and Logstash correctly.

Next, we create Data View to visualise data from the nginx-logstash index. Still on the left Menu, go to Discover -> click Create data view.

We fill in the info as follows:
- Name: nginx-logs (you can name anything you want)
- Index pattern: nginx-* (match any index starting with “nginx-“)
- Timestamp field: Leave as default.
Click Save data view to Kibana

Now we have a graph visualising your Nginx’s access log. I’m configuring it to show data in the last 15 minutes. If you try to access Nginx on web-01 server (for me is http://192.168.68.112) now to test, logs will show up here after a few seconds.

To view details from a log’s timestamp. Click on the toggle icon as in the attached photo. Here we will have information such as _index (index name), agent.name (server sent log to), event.oringal (messages from the log), etc.

If it shows empty, it just means you probably selected a very short timeframe when it has no log to record. For example:

We can do a lot of filter actions. For example, if I want to know how many users have accessed the web-01 server last 24 hours. Select a timeframe of the Last 24 hours. Type agent.name.keyword: web-* in the filter search box (I only have one, but if you have more than 2 web servers, you can set it e.g. web-* to show all events from those; otherwise, can specify the exact name, e.g. web-01). Or click agent.name on the left menu to view how many records hit our web server in total. Each record is equivalent to 1 access. Or move the cursor to the green column to view the summary.

That’s all we need. Congratulation! We’ve done the basic setup to collect Nginx’s log and send it to a centralised ELK system.
Step 3 (Optional): Configure Logstash to tailor log indices for different log types.
In the basic example above, we only configure Logstash to receive nginx logs from Filebeat only. Imagine we have multiple log types (that’s in reality), and want to send them all to Logstash, it becomes a mess because the Logstash outputs only one index name “nginx-logstash” as we configured as above. This means this index now holds a bunch of log types, which is not good for management and tracing log.
Ideally, in some specific circumstances, we may want to have each log type have its own index name For example, Nginx’s logs have an index name “nginx-logstash”, while System’s logs have an index name “system-logstash”. This is just a basic idea that I want to describe and make it easier to demo here. We will have more advanced things if you dive in deeply. But I’ll let your curiosity evolve then 😀
This is when the plugin filter actually comes in (we have only used input and output in the previous example). See filter options here for more details.
To implement this, I’ll simplify the Logstash configuration by breaking down the existing config file (/etc/logstash/conf.d/nginx-logstash.conf) into four separate files:
- 01-beats-input.conf: Contains only the input plugin configuration.
- 10-nginx.conf: Defines the filter plugin for processing Nginx logs, including renaming fields to modify the index name.
- 10-system.conf: Defines the filter plugin for processing system logs. In this example, I’ll capture logs from
/var/log/syslogand modify field names to change the index name. - 30-elasticsearch-output.conf: Configures the output plugin configuration.
The numeric prefix in each filename determines the order in which Logstash loads them. For example, 01-beats-input.conf is loaded first, followed by files with the 10-* prefix, and finally, 30-*.
1. Breaking down logstash configuration into corresponding files on server 2:
On server 2 (ELK server), in /etc/logstash/conf.d, run vi 01-beats-input.conf file with content:
input {
  beats {
    port => 5044
  }
}
Press :wq! to save the file.
Next, still in the same directory, run vi 10-nginx.conf file with content, I’m using mutate option to tailor the field from the event which Filebeat sent to:
filter {
  if [type] == "nginx" {
    mutate {
      add_field => [ "log_type", "nginx" ]
    }
  }
}
Press :wq! to save the file. Note the [type] == "nginx" is what we have configured in the Filebeat setting on web-01
The filter plugin is very powerful and helps you manipulate a lot of raw data and organise it in the way you want. Here is just a basic step to make an example of modifying raw data.
Next, run vi 10-system.conf file with content:
filter {
  if [type] == "syslog" {
    mutate {
      add_field => [ "log_type", "system" ]
    }
  }
}
Press :wq! to save the file.
Next, run vi 30-elasticsearch-output.conf file with content:
output {
  elasticsearch {
    index => "%{log_type}-logstash" # we dynamically set name for each log type
    hosts => ["192.168.68.111:9200"] # Change this to your hostname
    user => "elastic"
    password => "zgILNPL4N0wnulw5tDrv" # Change this to your password
    ssl_enabled => true
    ssl_verification_mode => none #Enable "full" and you will need to implement /etc/elasticsearch/certs/http_ca.crt.
    ilm_enabled => false
  }
}
Press :wq! to save the file.
NOTE: Need to set ilm_enabled => false here to dynamically set the index name for each log type. That’s because we want to write different indices into one output. For more details, see the reason here.
Delete the old nginx-logstash.conf file:
rm nginx-logstash.conf
You will have the config files like:

Restart Logtash service to make the new configuration take effect.
systemctl restart logstash
2. Add a new Filebeat config file for syslog on server 1:
On server 1 (web-01), run vi /etc/filebeat/conf.d/system-logs.yml and add content like this:
---
- type: log
  paths:
  - /var/log/syslog
  scan_frequency: 10s

  fields:
    type: syslog
  fields_under_root: true
Run filebeat test output to test output again. Make sure it’s ready.
Restart filebeat service to make the new configuration take effect.
systemctl restart filebeat.service
Now Filebeat is sending logs from Nginx and Syslog to logstash already. To check, go back to Kibana at the Menu (at the top left corner) -> Stack Management -> Index Management, you’ll see the indices of these logs appear like:

Next, we create Data View again to visualise data from the system-logstash index (similar we did for nginx-logstash). Still on the left Menu, go to Discover -> select nginx-logs menu -> select Create a data view

Filling in the information as below:

Ok, we have a new log type for system-logs to view here.

To switch between different log types, select system-logs menu -> you’ll see a list of log types you have configured.

Congratulations! You have successfully configured a centralised logging system using the ELK stack. I hope you’ll find this guide helpful and that it facilitates your work with the ELK stack.
If you like my blog post and want to find a way to thank me, feel free to Buy me a coffee to support me in providing more quality content, or simply share it with others who may have the same issue. Thanks for reading my blog.
Share this:
Discover more from Turn DevOps Easier
Subscribe to get the latest posts sent to your email.